How our running tools work — and how to actually use them
RaceTurkiye
August 15, 2026 · 10 min read
We recently added a "Tools" link to the top navigation: a hydration calculator, a fuelling calculator, a pace converter, a km-effort calculator, and the GPX Explorer. All five are free, need no account, and run entirely in your browser — nothing you type gets sent to our servers. This post walks through the formula behind each one, where it comes from, and — just as importantly — how much you should and shouldn't trust the number it gives you.
Because here's the honest starting point: none of these tools know you. They don't know how many years you've been running, how you feel that particular morning, which gel your stomach tolerates, or how technical a given trail actually is underfoot. They take a handful of numbers you enter and turn them into an estimate using formulas that hold, on average, across large populations. An estimate is a useful starting point. It is not an authority that overrides your own judgment on race day — you know your own body better than any formula does.
Pace Converter: why grade eats your pace
Running 5:00/km on flat ground does not mean you can hold anything close to that pace on a 10% climb. The metabolic cost of running uphill rises much faster than the grade itself, and the relationship is not a straight line.
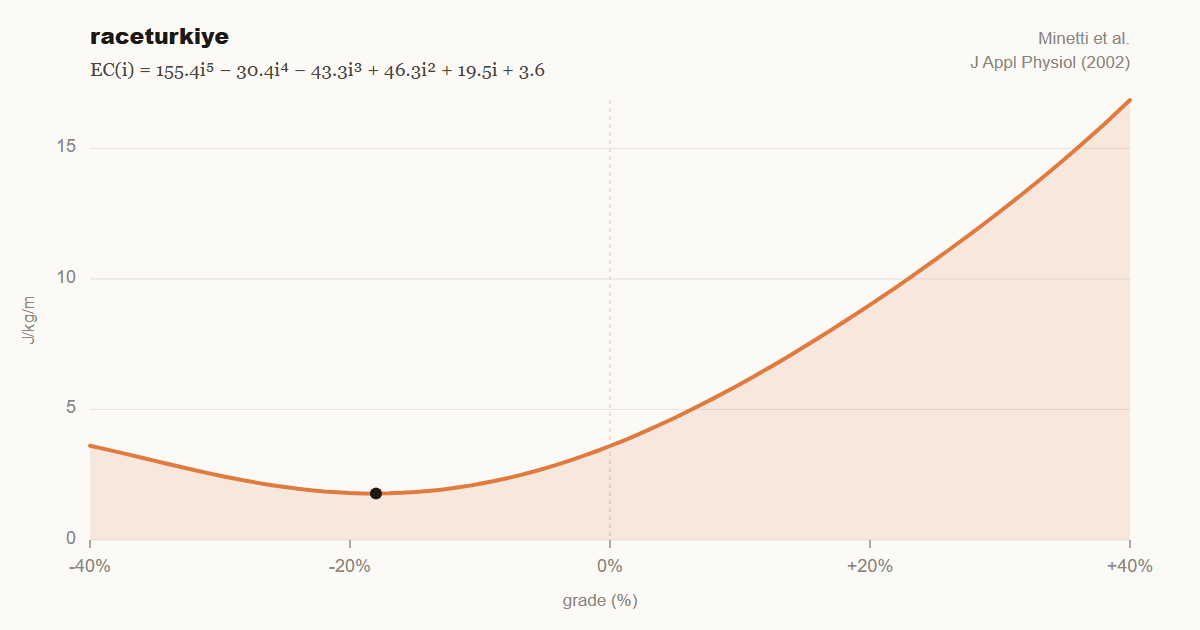
Our tool uses the polynomial published by Italian physiologist Alberto Minetti and colleagues in 2002, modelling the energy cost of walking and running across a wide range of slopes (Minetti et al., "Energy cost of walking and running at extreme uphill and downhill slopes", Journal of Applied Physiology, 2002). The formula converts grade (i, as a decimal fraction, positive uphill) into energy cost per kilogram per metre travelled, in joules:
EC(i) = 155.4·i⁵ − 30.4·i⁴ − 43.3·i³ + 46.3·i² + 19.5·i + 3.6
The most interesting feature of this curve is that cost bottoms out on a gentle downhill (around -10%), then rises again on steep descents past about -20% — because braking your own body weight has a real energetic cost too. Our tool uses this cost ratio to convert your flat-ground pace into a grade-adjusted equivalent pace (GAP) at each gradient.
Similar models exist under other names in the field: Strava's GAP calculation and the hill corrections built into Jack Daniels' VDOT tables express the same underlying observation through different approaches — the cost of a steep climb doesn't scale linearly. We chose Minetti's polynomial because it's peer-reviewed, based on directly measured treadmill oxygen-consumption data, and one of the most commonly cited references in trail-running literature.
How to use it: don't read this table as "I must hold exactly this pace on every hill." Use it instead when planning training — to translate a flat effort into what an equivalent effort looks like on a hilly course, e.g. "this course averages 8% grade, so a 6:40 target pace is a fair equivalent of a 5:00 flat pace, not a sign I'm having a bad day." Your actual performance will also depend on fatigue, heat, surface (mud, rock, singletrack width) and technical difficulty — none of which the formula can see.
Km-Effort Calculator: distance alone doesn't measure difficulty
A flat 40 km road race and a 40 km trail race with 2,500 m of climbing share a distance label and almost nothing else. Km-effort collapses that difference into one number, using ITRA's (International Trail Running Association) official formula:
km-effort = distance (km) + elevation gain (m) / 100
ITRA's own worked example: a 40 km course with 2,500 m of elevation gain comes out to 40 + 25 = 65 km-effort. That number then maps onto ITRA's published race-category table: XXS (<25), XS (25-44), S (45-74), M (75-104), L (105-154), XL (155-209), XXL (210+). Our calculator does both steps — the number and the category (ITRA, "Race Categories and Points" official documentation).
We made a deliberate choice here: this calculator uses ITRA's original formula, which does not account for descent at all. Our own km-effort figure inside the GPX Explorer, by contrast, uses the extended version published by trailmath.run, which adds a descent cost term (D-/150) — because long technical descents are a real source of fatigue too. Both are legitimate; they just answer different questions. The number in this calculator answers "how would ITRA officially classify this course"; the number in the GPX Explorer is closer to "how tiring is this specific route likely to feel."
How to use it: before signing up for a race, compare its published km-effort figure against your own past experience — if you already hold an ITRA index, you're likely already choosing races by these same thresholds. But remember: two courses both rated at 65 km-effort, one with sustained technical rock descents and one on soft forest track, will feel very different on the ground. The formula sees neither surface type, technical difficulty, nor altitude (less oxygen up high).
Fuelling Calculator: how many grams of carbohydrate per hour
During a long effort, liver and muscle glycogen deplete at a fairly predictable rate, and the gut can only absorb outside carbohydrate at a limited rate (the intestinal absorption ceiling). The American College of Sports Medicine's (ACSM) sports nutrition position stand and related literature (including Jeukendrup, "Nutrition for endurance sports", Journal of Sports Sciences, 2011) recommend a two-tier target based on duration:
Efforts up to 2.5 hours: 60 grams of carbohydrate per hour Efforts beyond 2.5 hours: up to 90 grams per hour (typically from glucose+fructose blends, since a single sugar source can't be absorbed that fast)
Our calculator applies this target to your estimated duration, then converts the total carbohydrate figure into a "how many gels is that" count using a roughly 25 grams-per-gel reference (actual gels vary from about 20 to 27 grams across brands; this is only meant to give a practical sense of how many packets to carry).
How to use it: don't apply this target on race day without testing it first. Your gut, like your muscles, is a trainable system — the adaptation is commonly called "gut training" and takes weeks to build. The calculator gives you a target range; only you, through long training runs, can find out which product, which flavour, and which frequency your stomach actually tolerates.
Hydration Calculator: the tool with the most assumptions
Of the four, this is the one carrying the most uncertainty, and we want to say that plainly. Sweat rate varies substantially between individuals, between days for the same individual, and with heat acclimatisation status — there's no practical way to measure it precisely outside a lab.
Our model follows an approach widely described in public sports-science sources: we start from a baseline sweat rate of 0.5 L/hour in cool conditions (5°C or below), add 0.035 L/hour for every degree above that, then scale the result by effort level (easy/steady/hard), humidity (low/moderate/high), your body weight relative to a 70 kg reference, and route steepness (a 10% bump for climbs averaging 30 m/km or more). The recommended intake is deliberately not the full estimated loss — it's 65 to 85% of it, because overdrinking (hyponatremia risk) is a real danger too, not just underdrinking. That range is capped to ACSM's published guidance of 400-800 mL/hour (ACSM Position Stand: "Exercise and Fluid Replacement", Sawka et al., 2007). The sodium target uses the same commonly cited 300-600 mg/hour range from the same guidance.
How to use it: treat this number as a starting point, not a ceiling. Your actual thirst, urine colour, and post-race weight change (losing a lot of weight suggests you underdrank; losing none or gaining suggests you overdrank) are far more reliable signals than the calculator. If you're not heat-acclimatised, or you're running further than you ever have before, the number can miss your real need in either direction.
How athletes can actually put these tools to work
Knowing the formulas above is one thing; fitting them into real training and race prep is another. Here are four concrete scenarios.
Example 1 — Sizing up an unfamiliar course: say a race three months out covers 32 km with 1,400 m of climbing. Run that through the Km-Effort Calculator first: 32 + 14 = 46 km-effort, putting it in ITRA's S category (45-74). If you've only ever raced in the XS band (25-44) before, that's a concrete signal to start building volume weeks earlier — not a surprise you discover on race morning.
Example 2 — Roughing out a race-day pacing plan: you can hold 5:30/km on flat ground, and one stretch of the course averages 12% climb. Enter 5:30 into the Pace Converter and read the 12% row: roughly 8:15-8:30/km as the equivalent effort. The value isn't "hold this pace exactly" — it's "trying to hold 5:30 here would blow me up, so slowing down on this section is expected, not a bad day." That turns an early climb from a panic moment into a planned gear-down.
Example 3 — Testing a fuelling strategy before you need it: for a race you expect to take about 4 hours, the Fuelling Calculator gives you roughly 90 g of carbohydrate per hour — about 14-15 gel-equivalents across the race. Rather than trying that for the first time on race morning, you run it in the coming weeks' long training runs — 3-4 gels an hour on any run past 3 hours — and learn which flavour and frequency your stomach actually tolerates. By race day the answer isn't "let's see," it's "I already know this works."
Example 4 — Building a hydration plan for a hot race: a tough 3-hour effort at 28°C in the afternoon, moderate humidity, fed into the Hydration Calculator, comes back with roughly 700-800 mL/hour — 2.1 to 2.4 litres over 3 hours, a realistic amount for a race vest to carry. Seeing that number ahead of time, you check the aid-station spacing on the course map and decide whether you need an extra flask. During the race itself, you weigh that estimate against your actual thirst and urine colour — the number tells you "probably around here," your body tells you "here's where I actually am right now."
The common thread: in all four examples, the tool doesn't make the decision for you — it gives you something concrete to plan around, early enough that you can still act on it, in training, in gear choices, in fuelling rehearsals, weeks before it actually matters.
Bottom line
All four calculators use formulas grounded in real, peer-reviewed or official sources — not made-up numbers. But they all share the same limitation: they turn a handful of inputs into an estimate that's accurate on average across a large population. Your body isn't the average of that population — it's a single data point.
The best way to use these tools is weeks before race day, to rough out a training plan. Test the numbers in training. On race day itself, the actual decision — am I thirsty, does my stomach agree with this, does this pace feel hard today — should come from you and your body that day, not from a calculator.
You can find all five tools here: /tools
Q: Are these calculators medical advice? A: No. They're educational estimates reflecting average trends in general sports-science literature; your individual health status, medications, or a doctor's guidance always take priority.
Q: Why might a result differ from the GPX Explorer's own numbers? A: The Km-Effort Calculator uses ITRA's original formula, which doesn't count descent. The GPX Explorer uses trailmath.run's extended version, which does. Both are correct — they answer different questions.

Comments & Questions
Sign in to comment
No comments yet. Be the first to write one!