How to use the GPX Explorer: a step-by-step guide
RaceTurkiye
August 17, 2026 · 8 min read
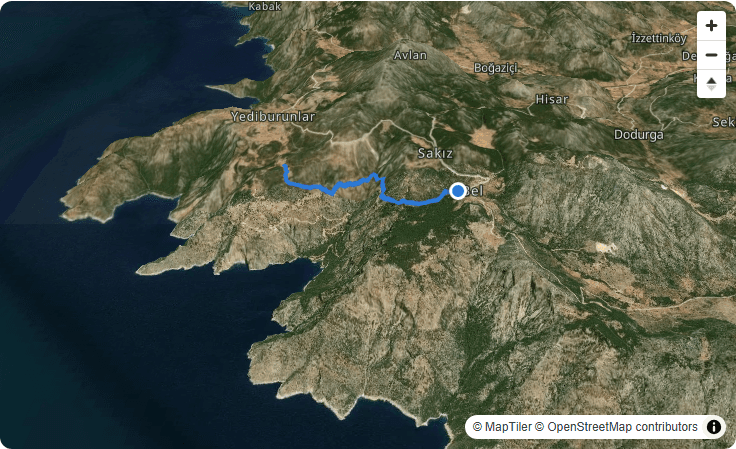
Say you signed up for a 50K mountain ultra two weeks ago — the organizer sent you the course GPX, but all you actually see is a line that says "50 km, +2,100m of climbing." What does that number really tell you? Is it hard, or manageable? How long will it take you? Where will you struggle? GPX Explorer exists to answer exactly these questions — a free tool that lets you upload any GPX file, fly through the route on a 3D terrain map, see real difficulty stats, and get a personal finish-time estimate based on your flat-ground pace. No account needed, and your file never leaves your device. This post walks through the tool from start to finish, with real examples.
Step 1: go to raceturkiye.com/parkur-analiz
The tool is reachable from the "Tools" section in the site's top navigation, or directly at /parkur-analiz. No sign-up or login required — the page is ready to use the moment it loads.
Don't have a GPX file handy? No problem — click "or try a sample route" on the page to instantly try a sample route traced from the Lycian Way. It's the fastest way to see what the tool does.
Step 2: upload your GPX file
Drag and drop your GPX file onto the box in the middle of the page, or click "Choose file" to pick one from your device. The only supported format is .gpx — exportable from most GPS watches, Strava, Komoot, and similar apps.
One useful detail: the file you upload doesn't have to be a recorded activity. You can upload the GPX of a route you're only planning to run — every statistic (distance, elevation gain/loss, km-effort) is derived purely from the route's coordinate and elevation data. This is exactly how you'd check the course file an organizer shares, before you ever run it.
After uploading, there's a brief processing step ("Processing file…"). If your file has no elevation data at all, the tool automatically tries to fill it in from terrain data in the background ("Looking up elevation data…") — even if that lookup fails, the rest of the results (distance, map) are unaffected.
Step 3: read the core stats
Once the file is processed, you'll see five stat tiles:
- Distance: the route's total length (km)
- Elevation Gain: total climbing over the route (m)
- Elevation Loss: total descending over the route (m)
- Km-Effort: a combined difficulty score turning distance and elevation into one number
- Steepest Grade: the steepest sustained section, measured over ~100m windows
Below the km-effort number is a small equation showing how it's built: flat km + climb km + descent km = total km-effort — a practical way to understand what a "42K but +2,500m of climbing" course is really equivalent to in flat kilometers, and it can make a genuinely large difference. Here's an example comparing two routes at the exact same distance:
| Route | Distance | Gain | Loss | Km-Effort |
|---|---|---|---|---|
| Flat road half marathon | 21.1 km | +80m | -80m | 22.4 |
| Mountainous trail half marathon | 21.1 km | +1450m | -1450m | 45.3 |
You can't tell these two routes apart from a race page that just says "21K" — they're both the same distance. Km-effort makes the difficulty that distance hides visible.
The km-effort calculation is based on the methodology published by ITRA (International Trail Running Association), but we add an extra descent cost to reflect the real muscular load of steep downhills — so this number may not exactly match ITRA's own official calculator. The "How Are These Stats Calculated?" section at the bottom of the page explains the difference in full.
Step 4: explore the route on the 3D map
Below the stats, a 3D map renders your route on real satellite imagery and terrain data. You can rotate, zoom, and change the viewing angle with your mouse or touchscreen.
Click "Fly through the route" and the camera automatically follows the course from start to finish — a fast way to get a mental picture of the whole route before race day. Stop the flight at any time with the "Stop" button.
Step 5: check the elevation profile
Below the map is a chart showing the route's elevation from start to finish. It shows you where the climbs start, where the longest flat stretches are, and where the highest point falls along the course — useful for deciding where to save your energy on race day.
Step 6: estimate your finish time with the Personal Plan
One of the most useful sections on the page, Personal Plan, sits right below the elevation chart and lets you:
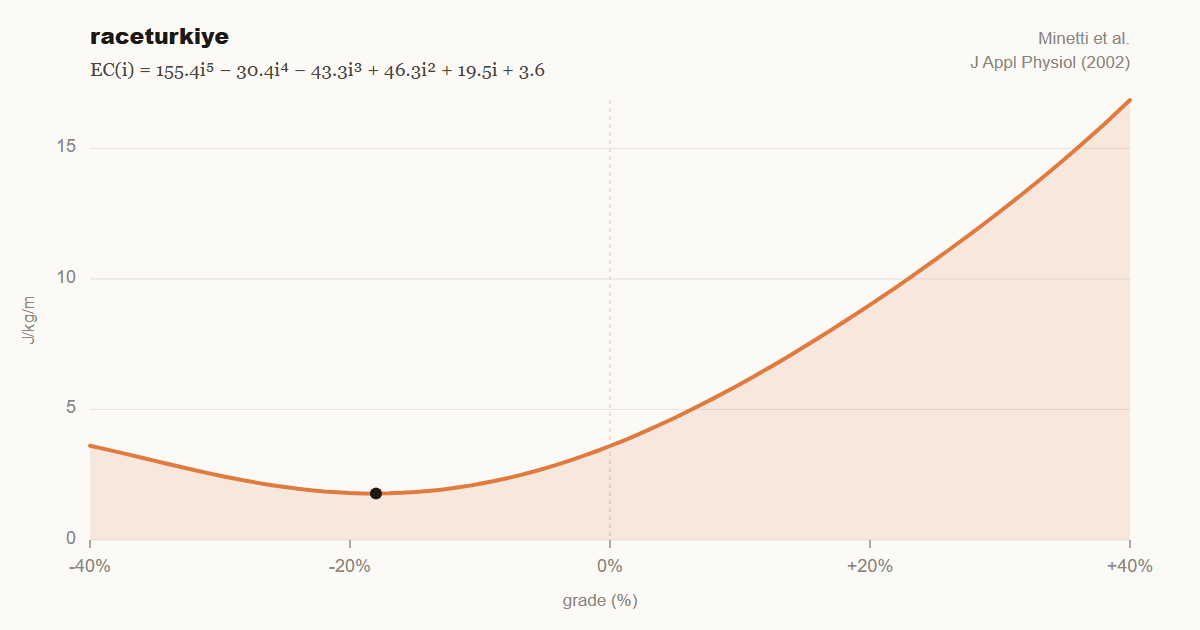
Enter your flat-ground pace (e.g. 6:00 min/km — a comfortable, sustainable pace). The tool automatically grade-adjusts that pace across the route, accounting for how much you'll slow down on steep climbs and descents, to produce a realistic estimated finish time. "Average pace" isn't one number — it means something different at every meter of the course:
| 0 km | grade 0% | 6.0 min/km |
|---|---|---|
| 3 km | grade 0% | 6.0 min/km |
| 6 km | grade 12% | 10.9 min/km |
| 9 km | grade 15% | 12.4 min/km |
| 11 km | grade 3% | 7.0 min/km |
| 14 km | grade -10% | 3.6 min/km |
| 17 km | grade -6% | 4.3 min/km |
| 21 km | grade 0% | 6.0 min/km |
Even with a comfortable 6:00 min/km pace, a 15% climb slows that down to 12:24 min/km — nearly twice as slow. A descent does the opposite. An estimate built on a flat "average pace" assumption would be badly wrong on a course like this; that's why Personal Plan uses the whole grade curve instead of a single average.
You can also enter a target time directly (hours:minutes) — the tool then works backward to calculate the average pace needed to hit that time. Every time you change the pace field, the target time updates automatically; if you edit the target time by hand instead, that value takes over from the pace field.
Right below your estimated finish time, you'll see recommended per-hour nutrition targets (carbs, fluid, sodium) based on that estimate — a rough but useful starting point for how much fuel to carry on a long course.
Keep in mind this estimate assumes a constant effort level; it doesn't account for fatigue, rest stops, or pacing strategy. Treat it as a training reference, not a race-day guarantee.
Step 7: add checkpoints (aid stations, cutoffs)
If you're running an ultra, the Checkpoints table is especially valuable. For each aid station or checkpoint, enter a name, its distance in km, and a cutoff time if one applies. The tool calculates the estimated time and clock time you'll reach each one, based on the climbing/descending between checkpoints.
Here's a realistic scenario showing exactly what this table is for — a 50K ultra with a hard climb in the middle:
| Station | Km | Est. Arrival | Cut-off | Buffer |
|---|---|---|---|---|
| Start | 0 | 00:00 | — | — |
| CP1 | 12 | 01:29 | 03:00 | +91 min ahead |
| CP2 (summit) | 28 | 04:42 | 05:00 | +18 min ahead |
| CP3 | 34 | 05:10 | 05:30 | +20 min ahead |
| Finish | 50 | 06:56 | 08:00 | +64 min ahead |
You start with a comfortable 91-minute buffer at CP1, but the hard climb between km 12 and 28 eats that buffer down to just 18 minutes by CP2. You're still inside the cutoff — but barely, and you'd normally only discover that in the middle of the climb on race day. Loading the course ahead of time and checking this table answers "will I actually make that cutoff?" weeks before the race starts, not mid-climb.
If you manually correct the estimated time at one checkpoint (say, you know you'll be slower there in reality), the tool redistributes the remaining time across the rest of the route by grade-adjusted effort — editing one point doesn't break the whole plan.
Step 8: review your results, try another file if you want
Use the "Try another file" button at the top of the results to reset and upload a new GPX at any time. It's ideal for comparing different categories of the same race (say, the 42K and the 80K), or for sizing up a course's real difficulty before deciding whether to sign up.
Three real-life use cases
Deciding before you register: A friend invites you to a mountain race and you ask "is it hard?" Uploading the organizer's GPX (usually shared on the race page) and checking the km-effort and steepest-grade figures shows you the difference between "42K but flat" and "42K but +3,000m" before you ever sign up.
Gear and pacing strategy: See a long flat stretch on the elevation profile and you can plan to run tempo there; see a steep climb and you might plan to use poles. The nutrition targets in Personal Plan give you a rough starting list for how many gels or how much water to carry.
Seeing cutoff risk ahead of time: As in the example above, knowing in advance how much your buffer will shrink at a given checkpoint lets you decide whether to hold back pace earlier on — instead of discovering it in real time on race day.
A note on privacy
The GPX file you upload never leaves your browser — it's never uploaded to any server, only processed on your own device. That's not marketing copy; it's a direct consequence of how the tool is built: file reading and every calculation happen in your browser's own memory.
Check the FAQ
At the bottom of the page is an FAQ section covering things like how accurate GPS elevation data really is, why the km-effort figure may differ from ITRA's official value, and the difference between GPS-derived and topographic-map elevation gain. If a technical question comes to mind while using the tool, there's a good chance it's answered there.
Trying GPX Explorer costs nothing — no account, no payment. Grab the GPX file for your next race (or whatever course file the organizer has shared) and upload it at /parkur-analiz.
Comments & Questions
Sign in to comment
No comments yet. Be the first to write one!